
📌 Overview
When you see a pattern forming, identify it well and know when it should break. This is both a life lesson and a great stock market lesson. Likewise to our lives, a pattern has to break in the stock market for trade opportunities. There are different candlestick chart patterns in the technical analysis. The role of these patterns is to signal the start of an uptrend or downtrend with the help of a breakout point.
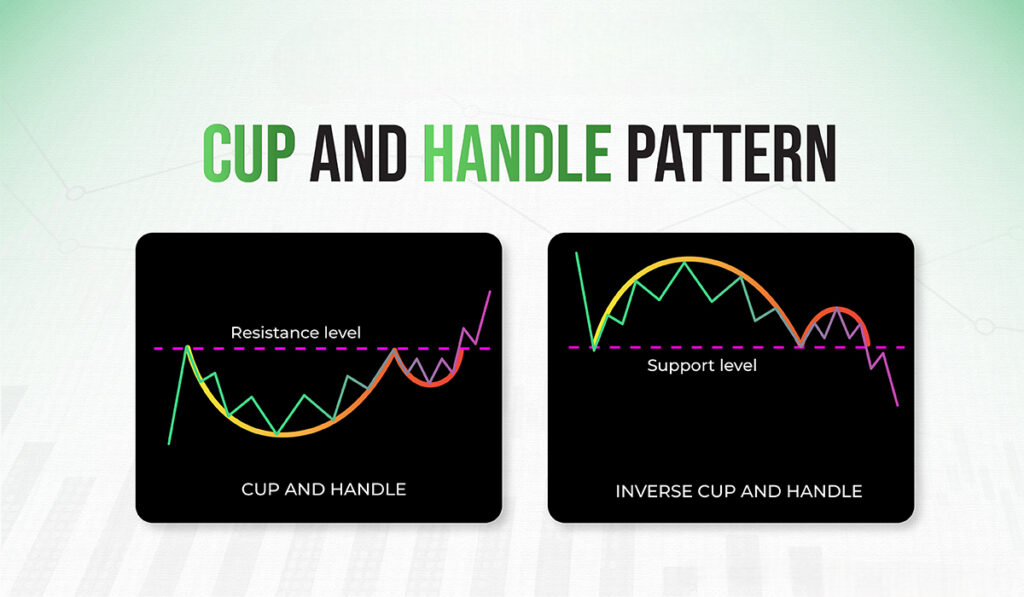
The cup and Handle pattern is one of the prominent patterns in technical analysis. It is of two types; cup and handle and inverted cup and handle pattern. The cup and handle pattern helps in signaling the uptrend in the chart. Whereas, the inverted cup and handle pattern help in signaling the downtrend in the chart.
Also Read : share market chart patterns
📌 What is Cup and Handle Pattern
The Cup and Handle pattern is one of the candlestick chart patterns that is used significantly by conventional traders. It is similar to the actual shape of the cup and handle, and traders use it as a reliable breakout trading strategy. Traders anticipate the pattern completion with a strong upmove and trade accordingly at the breakout point. It is considered an excellent bullish signal when used in accordance with demand and supply.
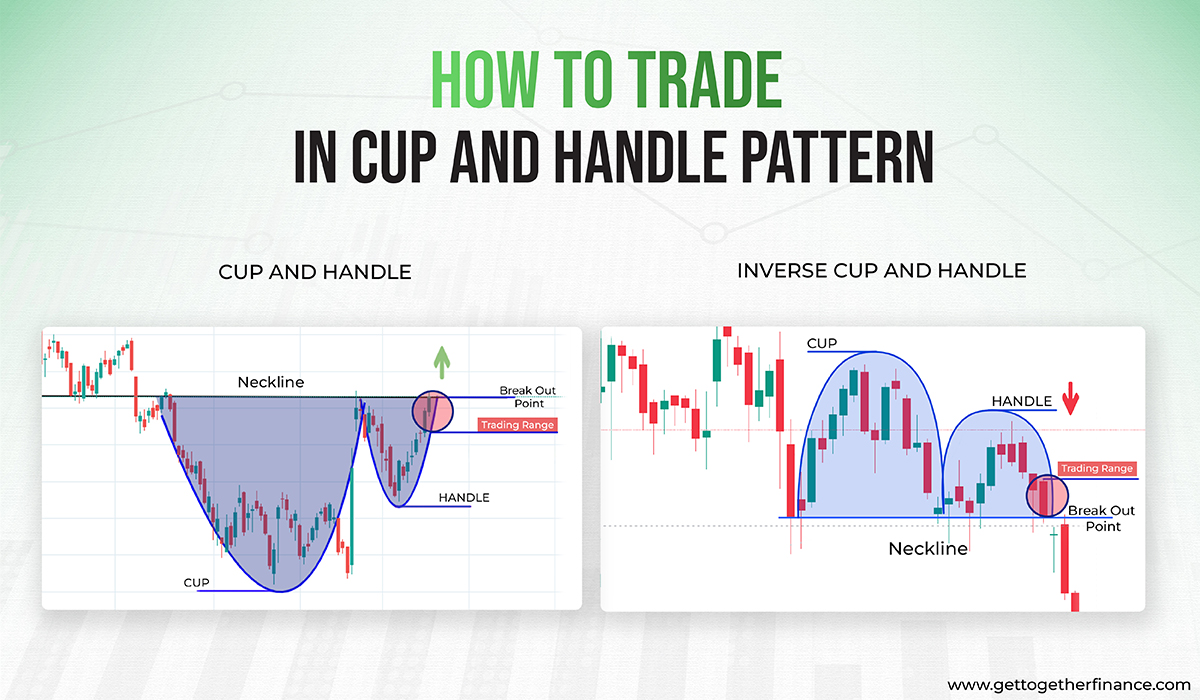
📌 Cup and Handle Pattern
As its name suggests, the cup and handle resembles the shape of a teacup and its handle. The cup has a “U” shaped pattern made by consecutive lows followed by consecutive highs in the candlestick chart.
After the “U” shaped pattern has formed, the price hits a new low by drifting sideways. This low is higher than the previous low and it again climbs up. Resulting in a smaller “u or v” shaped pattern. This part is identified as the handle. (This is smaller than the cup part formed beforehand)
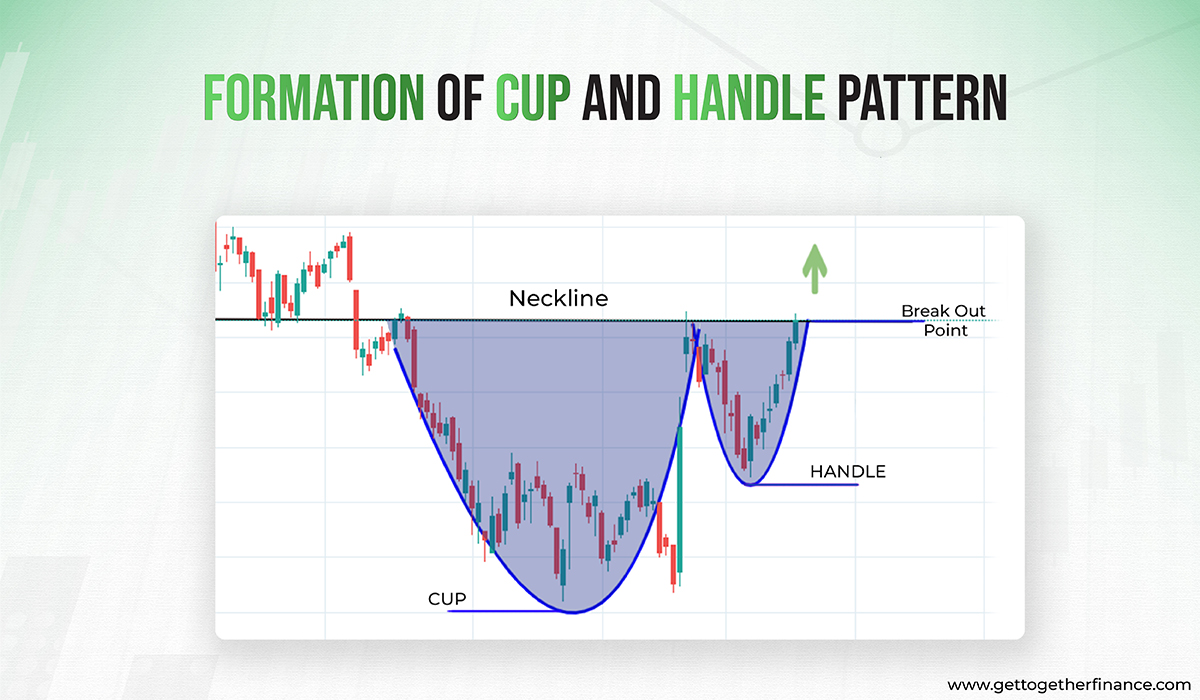
This pattern is considered a reliable bullish signal. After the pattern has formed, its breakout point can lead to a hike in stock price. The breakout point comes when the formation of the handle completes.
Remember: The handle pattern needs to be identified well. Traders need to remember that the low point of the handle should be higher than the low point of the cup.
Interpretation of Cup and Handle Pattern:
This pattern can be used in both forms; as a reversal pattern or as a continuous pattern. In the downtrend, cup, and handle patterns work as a trend reversal pattern.
When the Cup and Handle Pattern forms in the downtrend and the price goes up after the breakout point, resulting in a trend reversal.
Whereas, in the uptrend, this pattern indicates the continuation of the trend. When the Cup and Handle Pattern forms in an upward rally the price continues to go up after the breakout point. This breakout point comes after the end of handle formation.
The bullish continuation pattern occurs when buyers take a little pause before they take over the market all over again. It is similar to the situation when a lion takes two steps backward just to jump higher the next minute.
Also Read: RSI Indicator
📌 Understanding Cup and Handle Pattern
In the simplest language, the cup and handle patterns indicate that buyers are trying to take the price up by overpowering the sellers. The cup part is formed when the price steeps low but also recovers to the same point. After the formation of the cup, the price again tries to steep low but it is not equivalent to the depth of the cup and a strong pullback makes the handle part. This complete pattern is recognized as a cup and handle pattern, where it is anticipated that buying is getting stronger and institutions are trying hard to recover the price irrespective of selling pressure created by sellers.
📌 Inverted Cup and Handle Pattern
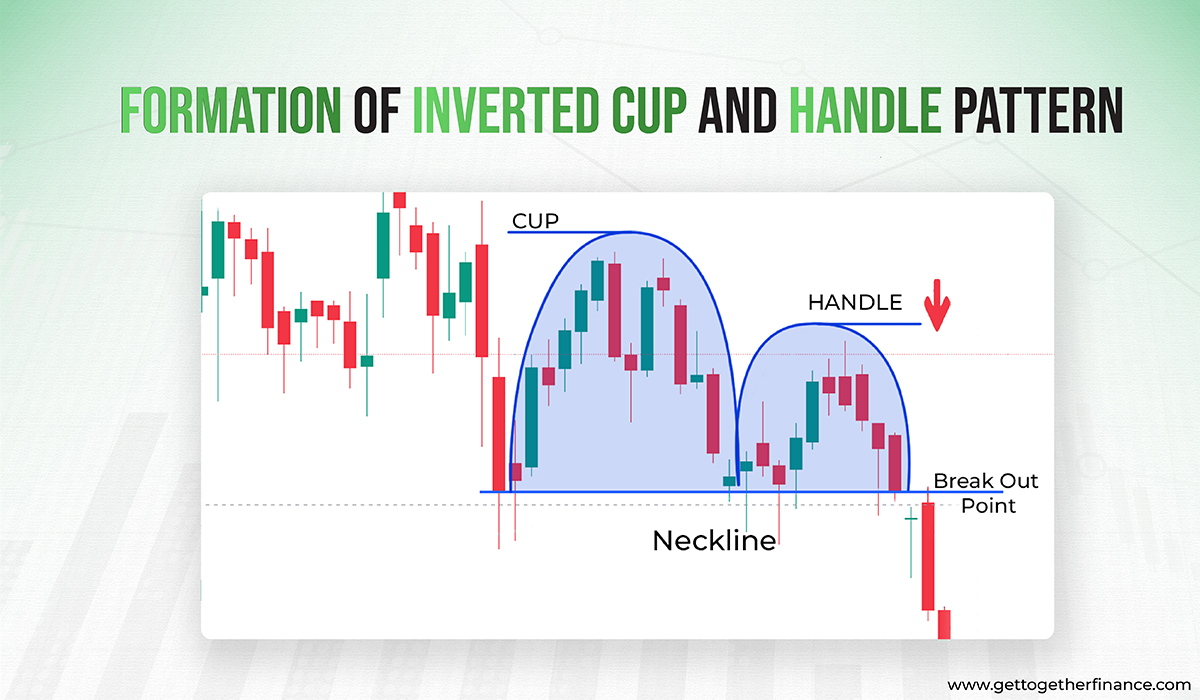
The inverted cup and handle pattern help in identifying the bearish trend in the candlestick chart. It is quite similar to the usual cup and handle pattern but in an inverted way.
The cup has an inverted “U” shaped pattern made by consecutive highs followed by consecutive lows in the candlestick chart.
After the “inverted U” shaped pattern has formed, the price hits a new high by drifting sideways. This high is lower than the previous high (high of the inverted cup) and it again falls down. Resulting in a smaller inverted “u or v” shaped pattern. This part is identified as the handle. (This is smaller than the cup part formed beforehand)
As this pattern is considered a reliable bearish pattern, its breakout point can lead to a downtrend.
Remember: The handle pattern needs to be identified well. Traders need to remember that the high point of the handle should be lower than the high point of the cup.
Interpretation of Inverted Cup and Handle Pattern:
The inverted cup and handle pattern signals the start of the downtrend. This can be used in both ways; as a reversal pattern or a continuous pattern. When an inverted cup and handle pattern is formed during a downtrend. Then, it is an indication that the downtrend can be continued. Whereas, when an inverted cup and handle pattern is formed in an uptrend, it is an indication of a trend reversal. After the formation of the pattern, the breakout point often leads to a downtrend in such situations. Traders use this opportunity to short-sell.
📌 What Does a Cup and Handle Pattern Indicate
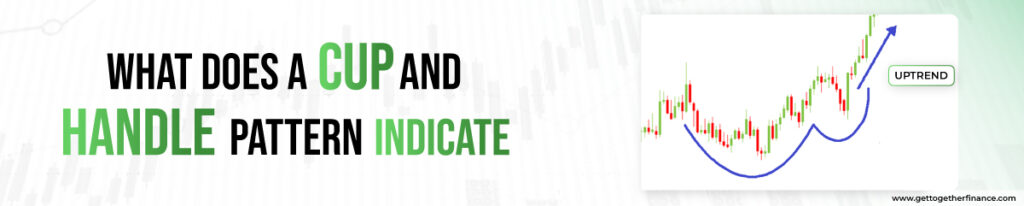
From the above analysis, it is crystal clear that the cup and handle pattern acts as an excellent bullish reversal signal. But now let’s understand why it is considered a bullish reversal or continuation of an uptrend. When we closely analyze the candlestick pattern of the cup and handle pattern, we can see price is finding it difficult to steep down from a certain point. In the round bottom of the cup pattern, prices consolidate for a while, here it can be interpreted that buyers are fighting hard to overpower sellers. Hence, the downtrend is losing its momentum.
In the handle, the price again tries to go down, but buyers end the slight downtrend by bringing the price up at an increased pace. Now, if we think logically, it is clear that buyers are trying hard to end the downtrend. This is enough to interpret that a good upmove is about to come.
Remember, analyzing these patterns is keeping track of institutional behavior. If you use this with advanced technical analysis supported by demand and supply. Then there is no one stopping you from becoming a profitable trader.
📌 How to Trade in Cup and Handle Pattern
Traders need advanced knowledge of technical analysis to know the entry and exit points in cups and handle patterns. In both, the cup and handle pattern and the inverted cup and handle pattern, the entry is taken at the breakout point.
1. Entry Point:
The entry point in both the patterns, is at the breakout point.
2. Stoploss:
The stop loss in both patterns should be placed below the handle pattern. In the case of the inverted cup and handle pattern, it should be placed at the high of the handle.
3. Target:
In both patterns, the target should be the opposite of the cup range. If the cup is formed between the range of 90-100, then the uptrend target should be near to 110. Whereas in the case of the inverted cup and handle if the cup is formed between the 100-90, then the target of the downtrend should be near 80.
📌 Example of Trading in Cup and Handle Pattern
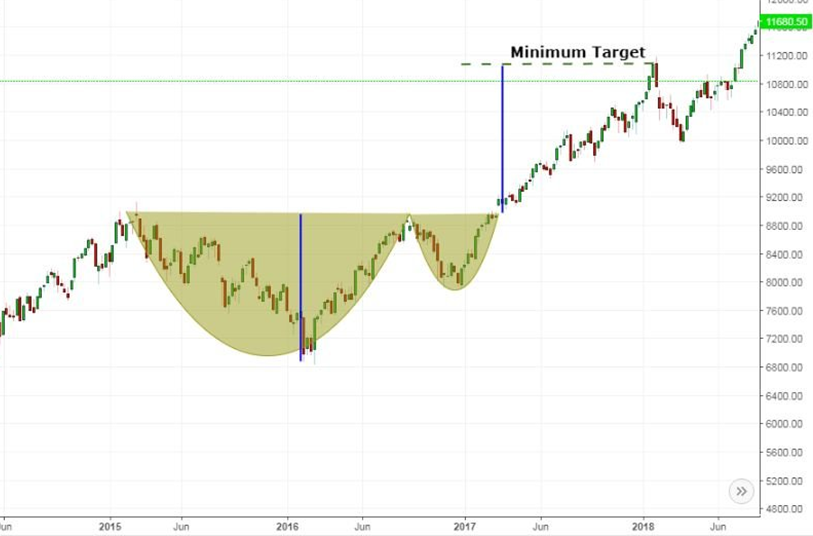
In the above example, the cup and handle pattern is easily traceable. Now after recognizing the pattern, you need to learn how to trade in this. Here, you need to take entry at the breakout point that comes after the completion of the handle pattern at the neckline (near 8800). The neckline is the resistance point from where the price tries to go downwards in the pattern.
The entry should be taken at the neckline after completion of the pattern as now the upmove is expected and the range is anticipated to break.
The stop loss should be placed below the trough or bottom of the handle pattern (between 7600 and 800). At last, here the target should be exactly the downfall percentage in the opposite direction (between 10800). In the above example, the target is set in the exact percentage of downfall that occurred in the cup pattern. Hence, you are hoping for a good up move equal to the downfall.
📌 What is the Target for Cup and Handle Pattern
In the easiest words, the target in a cup and handle pattern is equivalent to the depth of the cup. If the cup had the depth that brought a 2% downfall in the price. Then, the trader should target a 2% up move in the price from the breakout point at the neckline.
📌 Limitations of Cup and Handle Pattern in technical analysis

However, it can be considered an excellent signal to spot trend reversal and trend continuation. With the growing popularity, it has started trapping traders. The biggest limitation of the pattern is that it is not highly reliable when used alone. It should always be used with knowledge of technical analysis.
As said earlier, the false signal is always in there to trap the traders. You need to have advanced knowledge about technical analysis of trading to filter the false signals from the reliable ones. Many traders get driven by their emotions and make a hurry to enter the trade before the pattern has fully formed. In this pattern always wait until the pattern has been completed before making any move.
These patterns are quite common in the candlestick charts. But, using them with the advance technical knowledge like demand and supply forces makes it a high-probability setup.
- Cup and handle pattern can be spotted frequently on candlestick charts but using it in accordance with demand or support area makes it a high probability setup with less chances of failure.
- The same thing happens in the inverted cup and handle pattern can be spotted frequently on candlestick charts but using it in accordance with supply or resistance area makes it a high probability setup with less chances of failure.
Traders need in-depth knowledge of technical analysis to identify the demand and supply zones in the candlestick chart along with the patterns. If the knowledge of patterns is supported by in-depth technical analysis then it gets easier for traders to predict the movement of the stock. To learn about advance technical analysis, enroll in our Trading in the Zone course today and get free lifetime support too.
📌 Difference between Cup and Handle and Inverted Cup and Handle
| Cup and Handle Pattern | Inverted Cup and Handle Pattern |
| Resembles a teacup with a handle | Resembles a flipped tea cup with a handle |
| Indicates the trend reversal from a downtrend to an uptrend. (bullish indicator) | Indicates the trend reversal from uptrend to downtrend. (bearish indicator) |
| Can also act as a continuation pattern in an uptrend after the breakout point | Continuation after the breakout point is less common compared to cup and handle |
| The breakout point is at the resistance zone | The breakout point is at the support zones |
📌 Conclusion
In the trading world, patterns may be a game changer. The cup and handle pattern, like the teacup, indicates future changes or continuations. The Inverted cup and handle, on the other hand, provide traders with a unique perspective to the traders on the flip side. Both patterns give traders a risk mitigation area, as well as specified zones and starting points. This helps traders in making informed trading decisions and helps them avoid losses.
The Cup and Handle pattern is one of the most powerful chart patterns in technical analysis. It signals both trend continuation and trend reversal, depending on where it forms in the market. Similarly, the Inverted Cup and Handle pattern is equally important as it indicates potential bearish moves and provides traders with early exit or short-selling opportunities.
While both patterns give strong signals for entry, stop-loss, and targets, they should not be used in isolation. For higher accuracy, traders must combine them with advanced technical analysis, demand and supply zones, and strict risk management strategies.
By mastering these candlestick patterns, traders can gain an edge in predicting market movements, avoid false breakouts, and make better-informed trading decisions.
📌 FAQ on Cup and Handle Pattern
Q1. What is the Cup and Handle pattern in trading?
The Cup and Handle is a bullish candlestick chart pattern shaped like a teacup with a small handle. It indicates a continuation or reversal to the upside after a breakout.
Q2. How does the Inverted Cup and Handle pattern work?
The Inverted Cup and Handle is the bearish version, shaped like an upside-down cup. It signals a continuation or reversal to the downside after the breakout point.
Q3. Is the Cup and Handle pattern bullish or bearish?
- Cup and Handle → Bullish pattern (trend continuation or reversal).
- Inverted Cup and Handle → Bearish pattern (trend continuation or reversal).
Q4. How to trade the Cup and Handle pattern?
- Entry → At the breakout point after the handle is formed.
- Stop-loss → Below the handle (for bullish) or above the handle (for bearish).
- Target → Equal to the depth of the cup.
Q5. What is the target for the Cup and Handle pattern?
The target is generally equal to the depth of the cup. For example, if the cup depth represents a 10% drop, the target after breakout would be approximately a 10% rise.
Q6. Can Cup and Handle be used as a continuation pattern?
Yes, in an uptrend, it often signals continuation, while in a downtrend, the inverted cup and handle suggests bearish continuation.
Q7. What are the limitations of the Cup and Handle pattern?
It can give false signals if used alone. Traders should wait for full formation of the pattern and confirm it with demand & supply zones, volume analysis, and other indicators.